

View delivery logs
See every event Verto sent to your endpoint, with the request, the response and how long it took.
Every event Verto sends is logged on the subscription's detail page. To get there, click a subscription row in the Webhook subscriptions tab, or choose ⋮ → View logs.
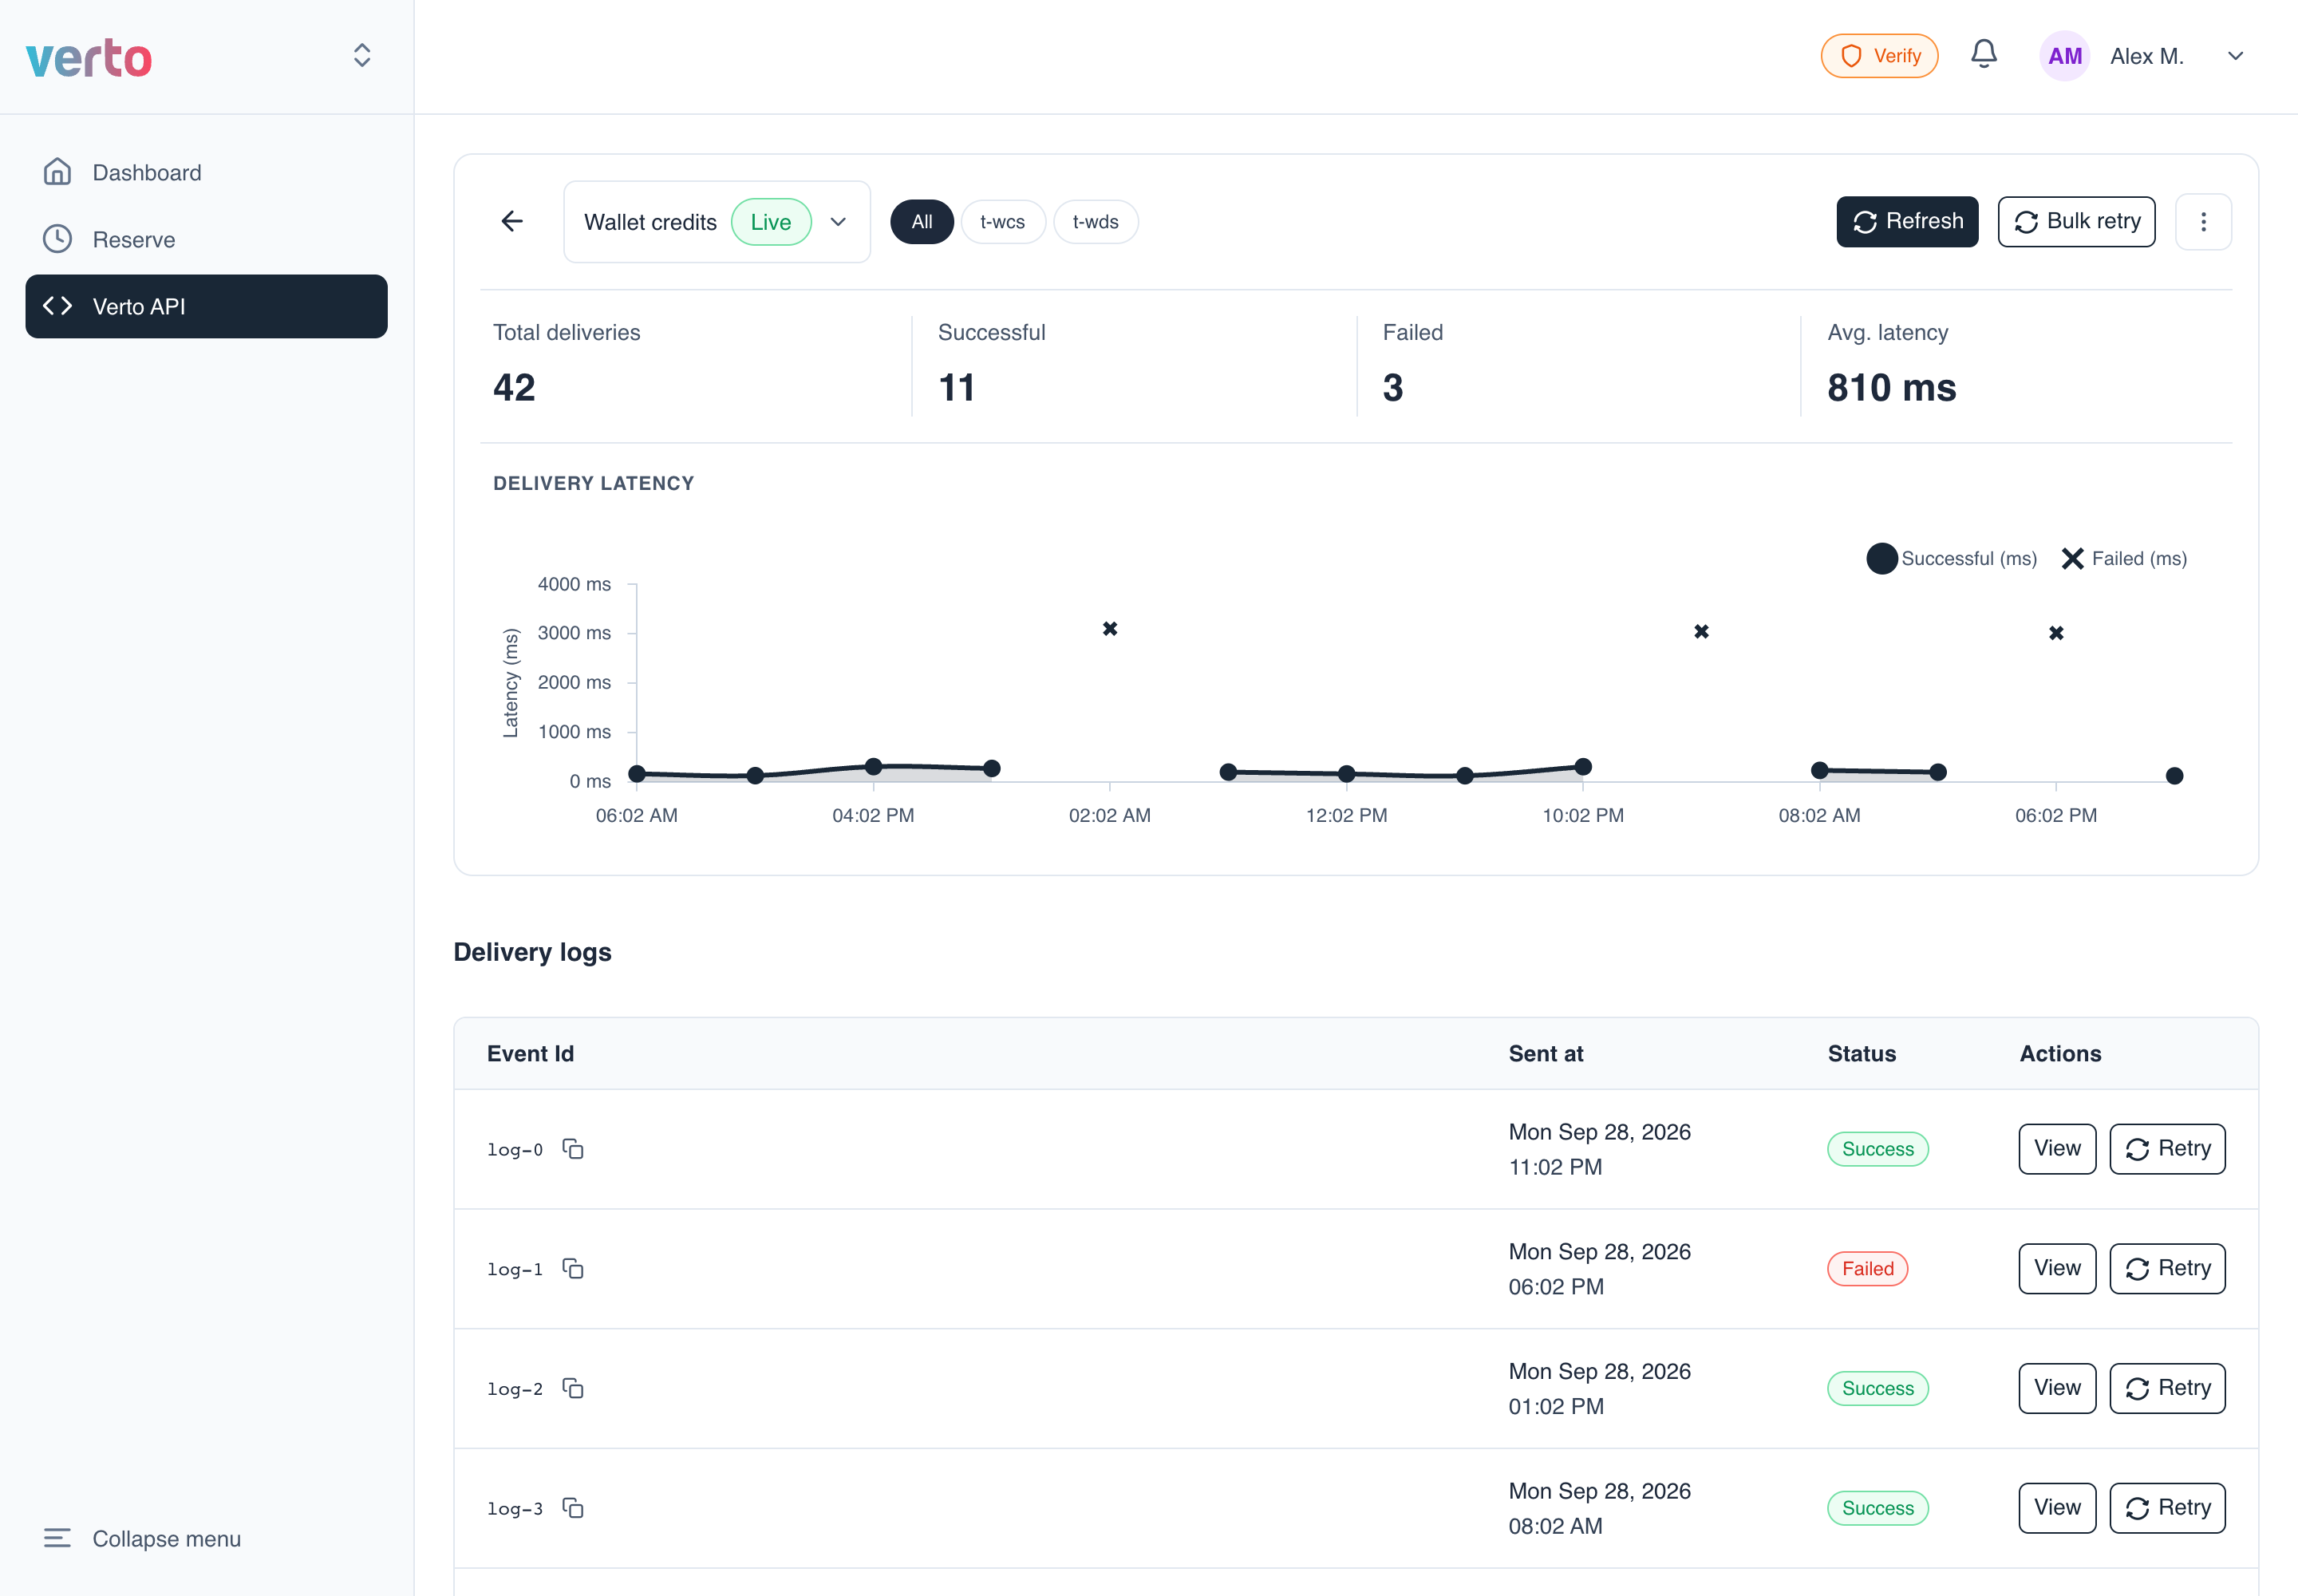
What's on the page
| Area | What it shows |
|---|---|
| Header | Subscription switcher (jump to another subscription, with search), Live/Inactive badge, Refresh, Bulk retry and the ⋮ menu (Test, Edit) |
| Topic filter | All plus one chip per topic. Click a chip to show only that topic's deliveries. It appears only when the subscription has more than one topic. |
| Stats | Total deliveries, Successful, Failed, Avg. latency |
| Delivery latency chart | How long each delivery took. ● = successful, ✕ = failed |
| Delivery logs | Event Id (with copy), Sent at, Status (Success / Failed), and View / Retry buttons. 20 rows per page. |
Page-level statsSuccessful, Failed, Avg. latency and the chart count only the page of logs you are viewing. Total deliveries counts all of them.
Inspect a single delivery
Click a log row, or its View button, to open Delivery response. It shows:
- Event ID, Sent at, Time taken and HTTP status (the status code your server returned)
- Request body: the exact JSON Verto sent
- Response body: what your server replied
Both bodies have a copy button, so you can paste them into your own debugging tools.
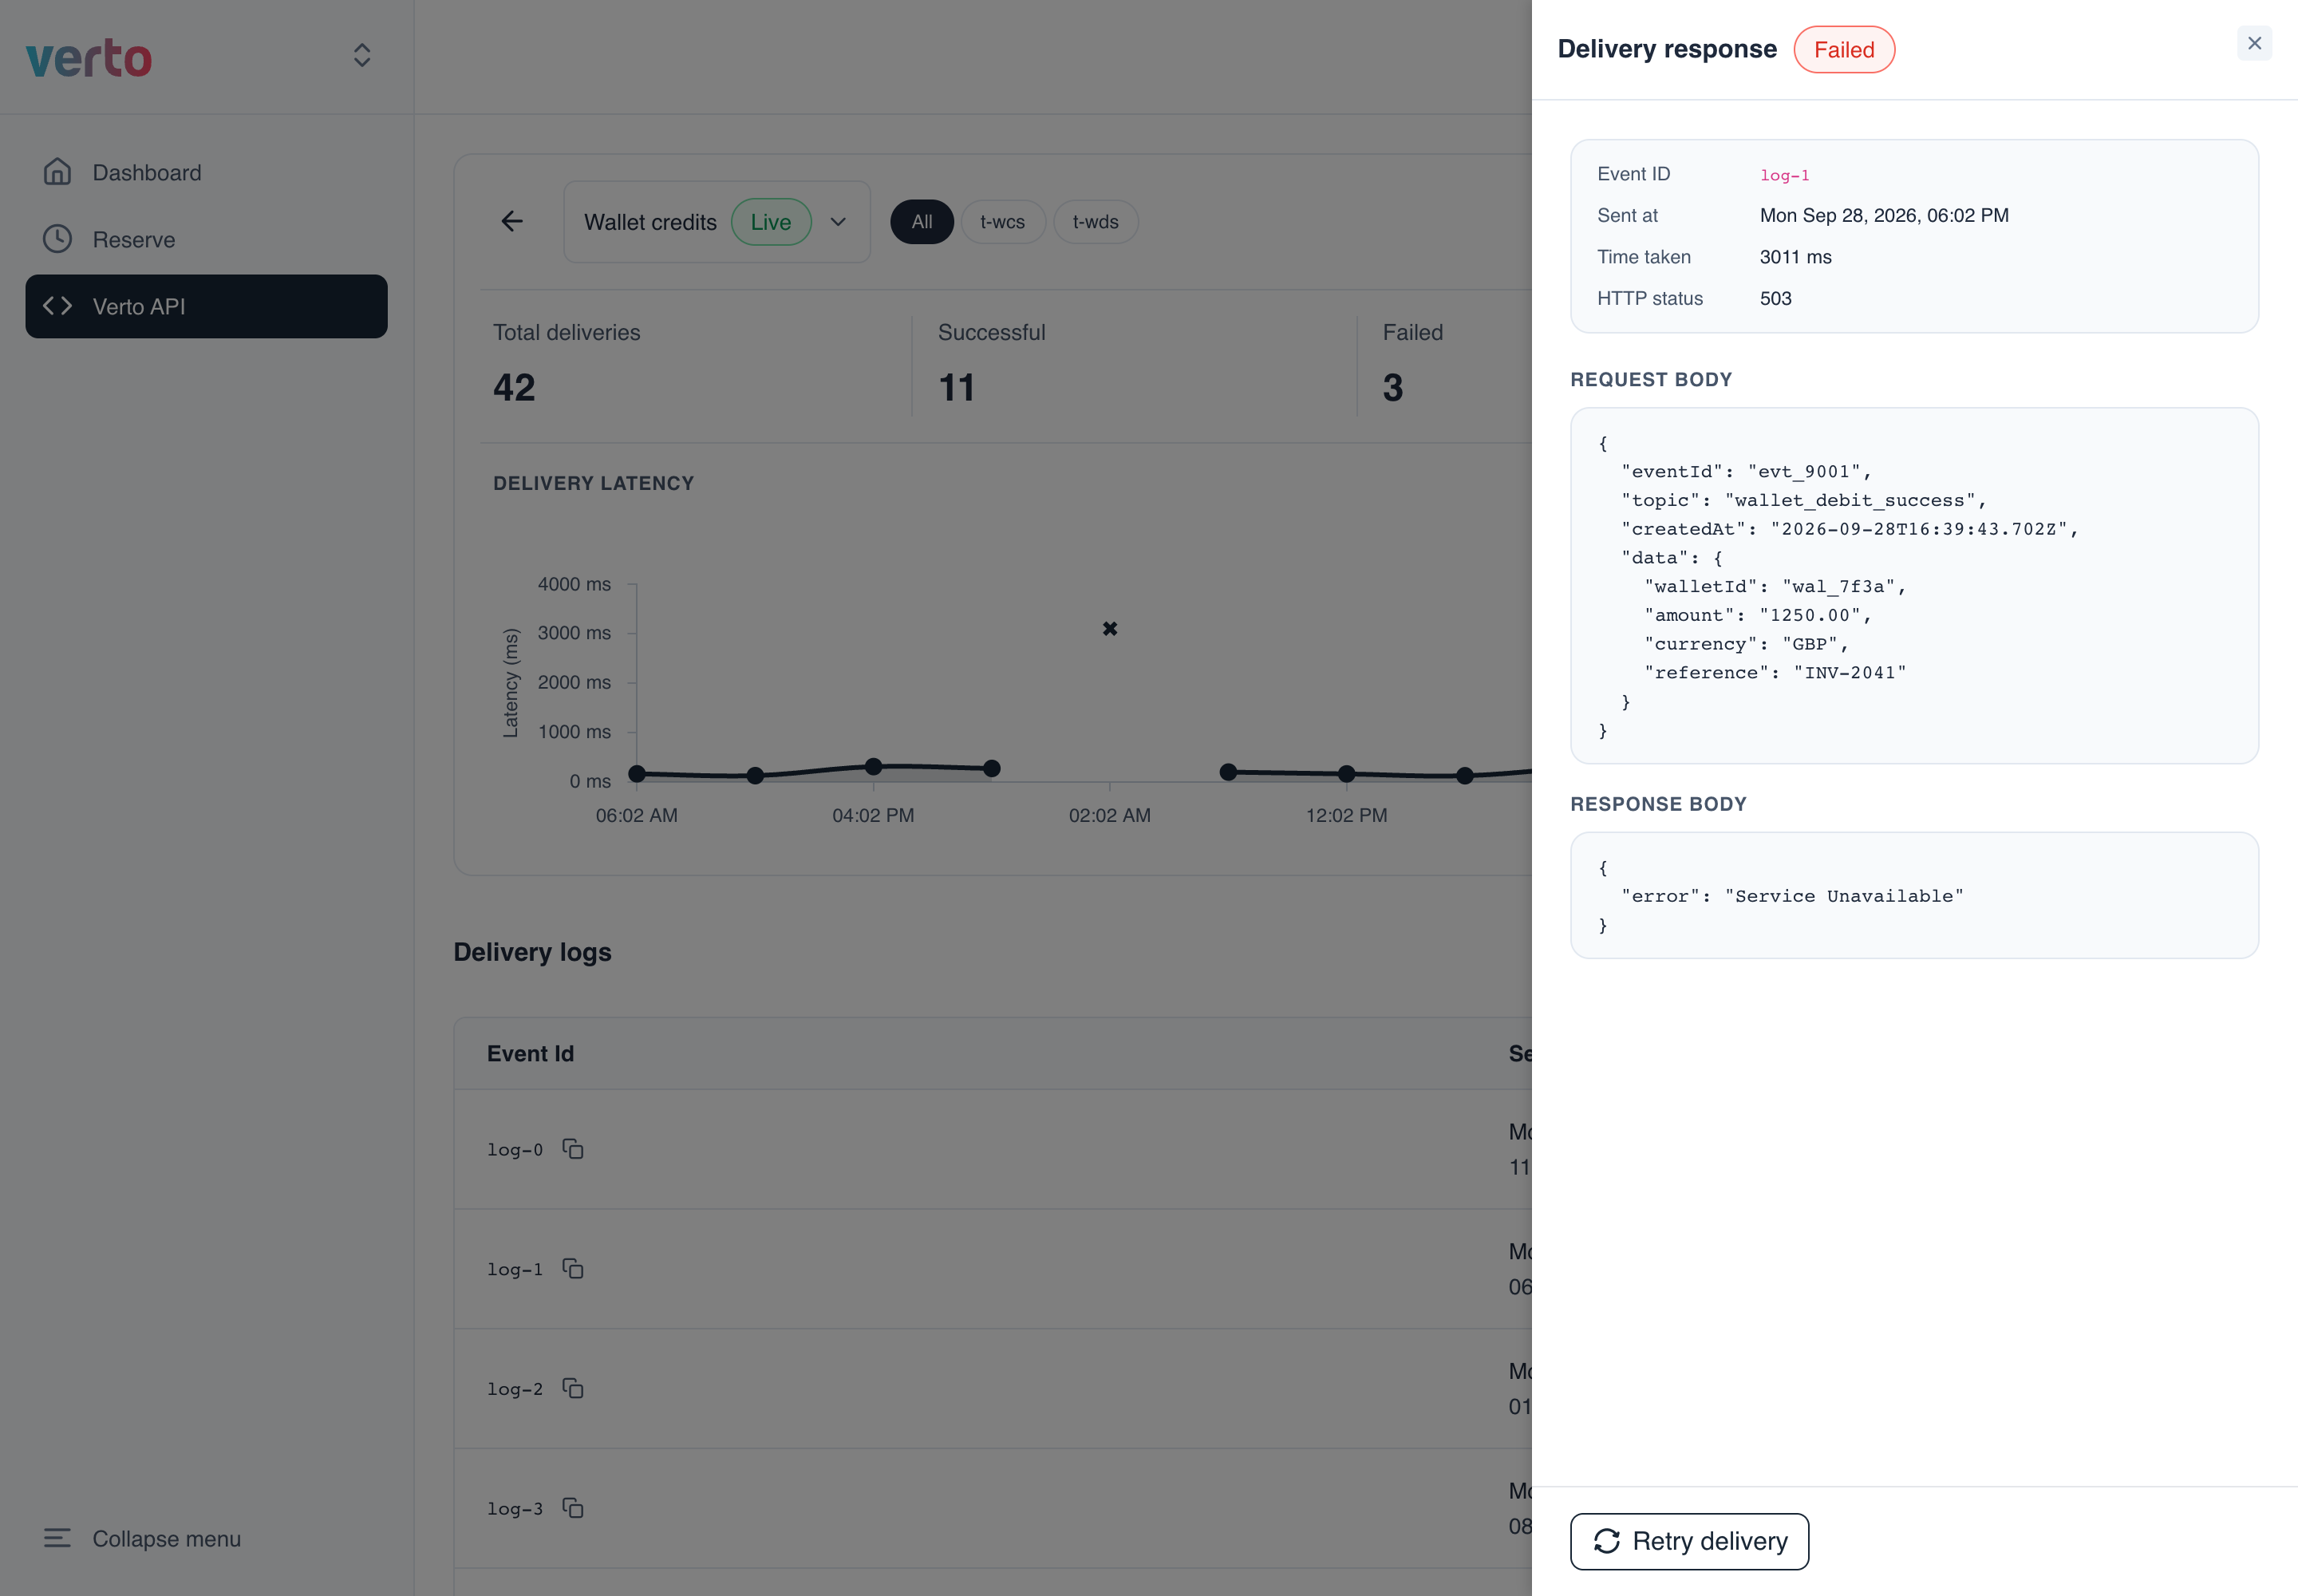
Found a failed delivery? Fix your endpoint, then retry it.
Updated 14 days ago
Did this page help you?